How to replay a simulation
In SCANeR, a simulation is composed of actors (e.g. cars, trucks, buses, motorbikes, pedestrians, etc…) performing actions according to a scenario that has been created by the user. Depending on the way you configure these actors, the simulation might not produce the same results each time. This is why we developed the Record module. This module, as its name implies, will record your simulation, and you will be able to replay it and extract data from the recording itself.
Note: With the Analyzing Tool, you will be able to create your own graphs, to correlate the exact data you want. But this will be for another guide that is coming soon 😉.
In this guide, I will explain how to record a simulation and replay it.
- Step 1. Add the
Recordmodule to your configuration and record a simulation - Step 2. Replay the simulation
- Step 3. Export a graph to a CSV file.
Let’s jump into the guide!
Step 1. Add the RECORDER module to your configuration and record a simulation
-
Open SCANeR studio and select
SIMULATIONmode.
-
Open the
CONFIGURATION MANAGERand click onAdd process. Search for theRECORDERmodule and add it to the configuration.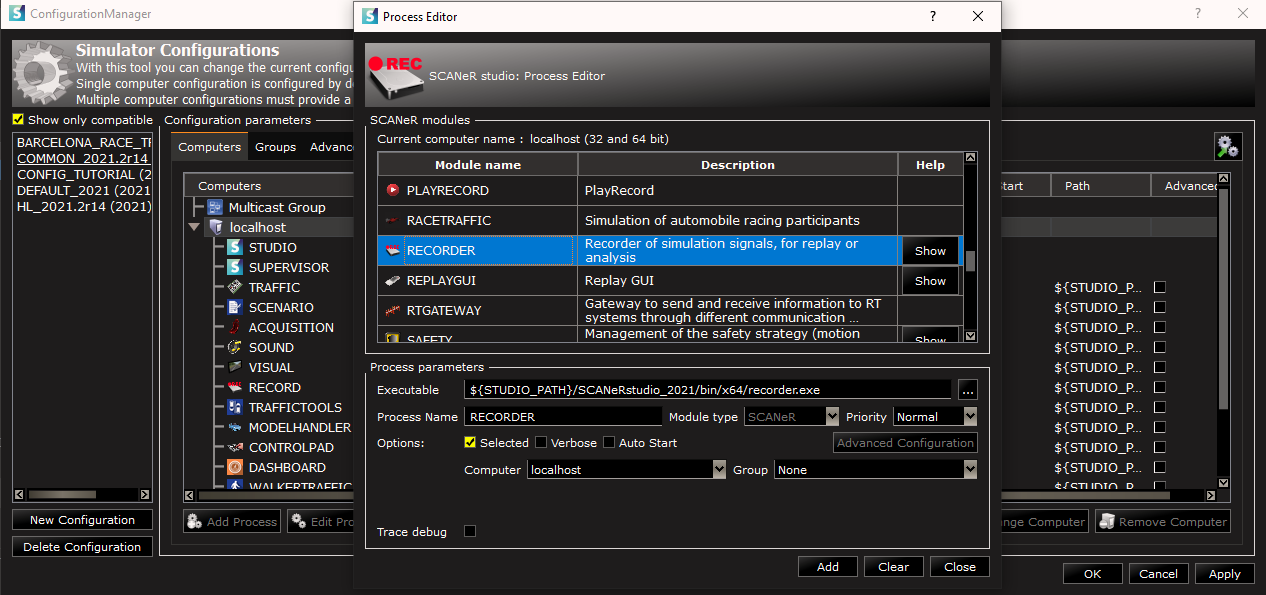
-
Open a scenario, and start the
RECORDERmodule by double clicking on it (in the screenshot it appears as ‘RECORD’). You can now play the simulation, and it will be recorded.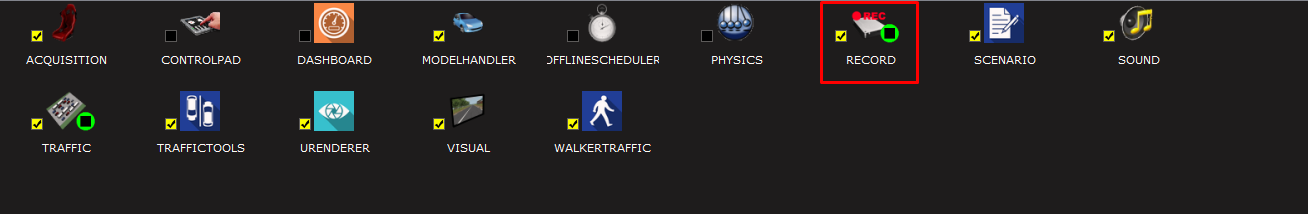
Step 2. Replay the simulation
-
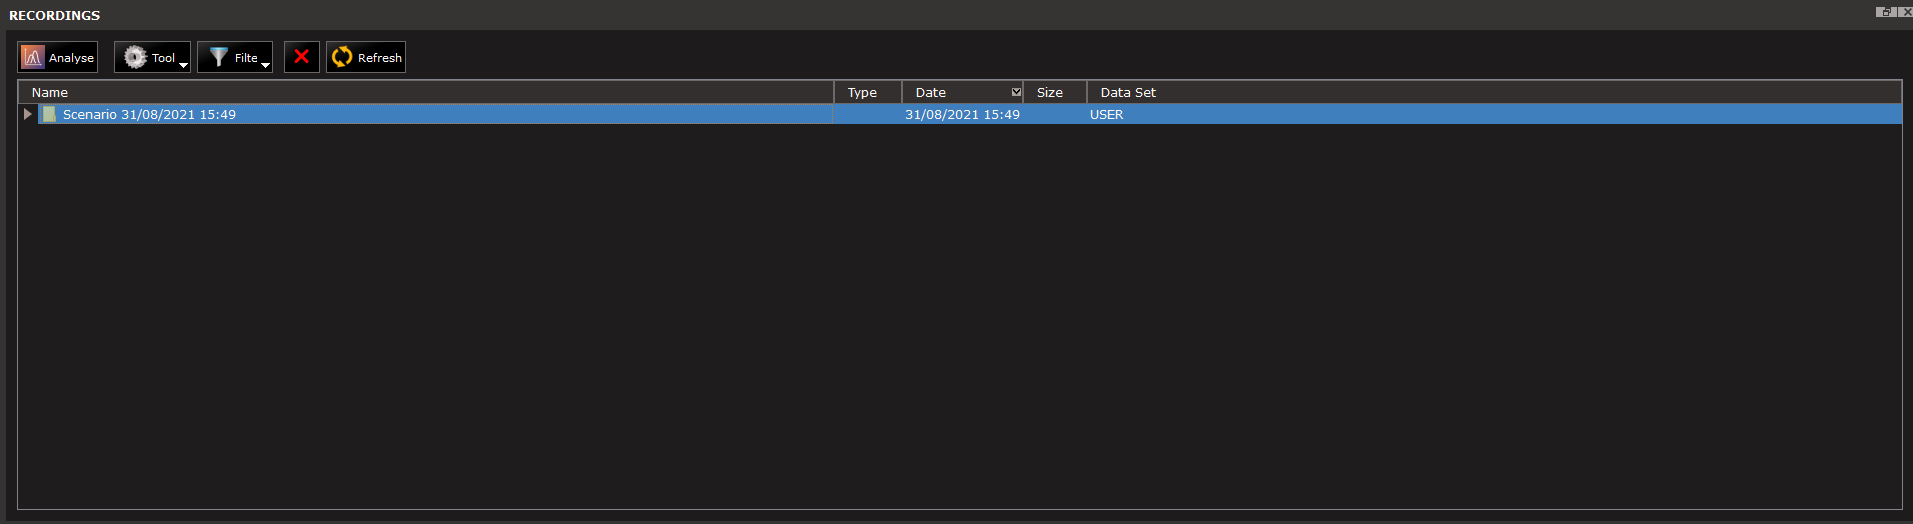
Open
ANALYSISmode.
-
In this mode, you will see the list of recorded simulations for the current configuration. Double click on the recording you want to replay.
-
You can now click on the
Playbutton. The recording will be played exactly according to the simulation.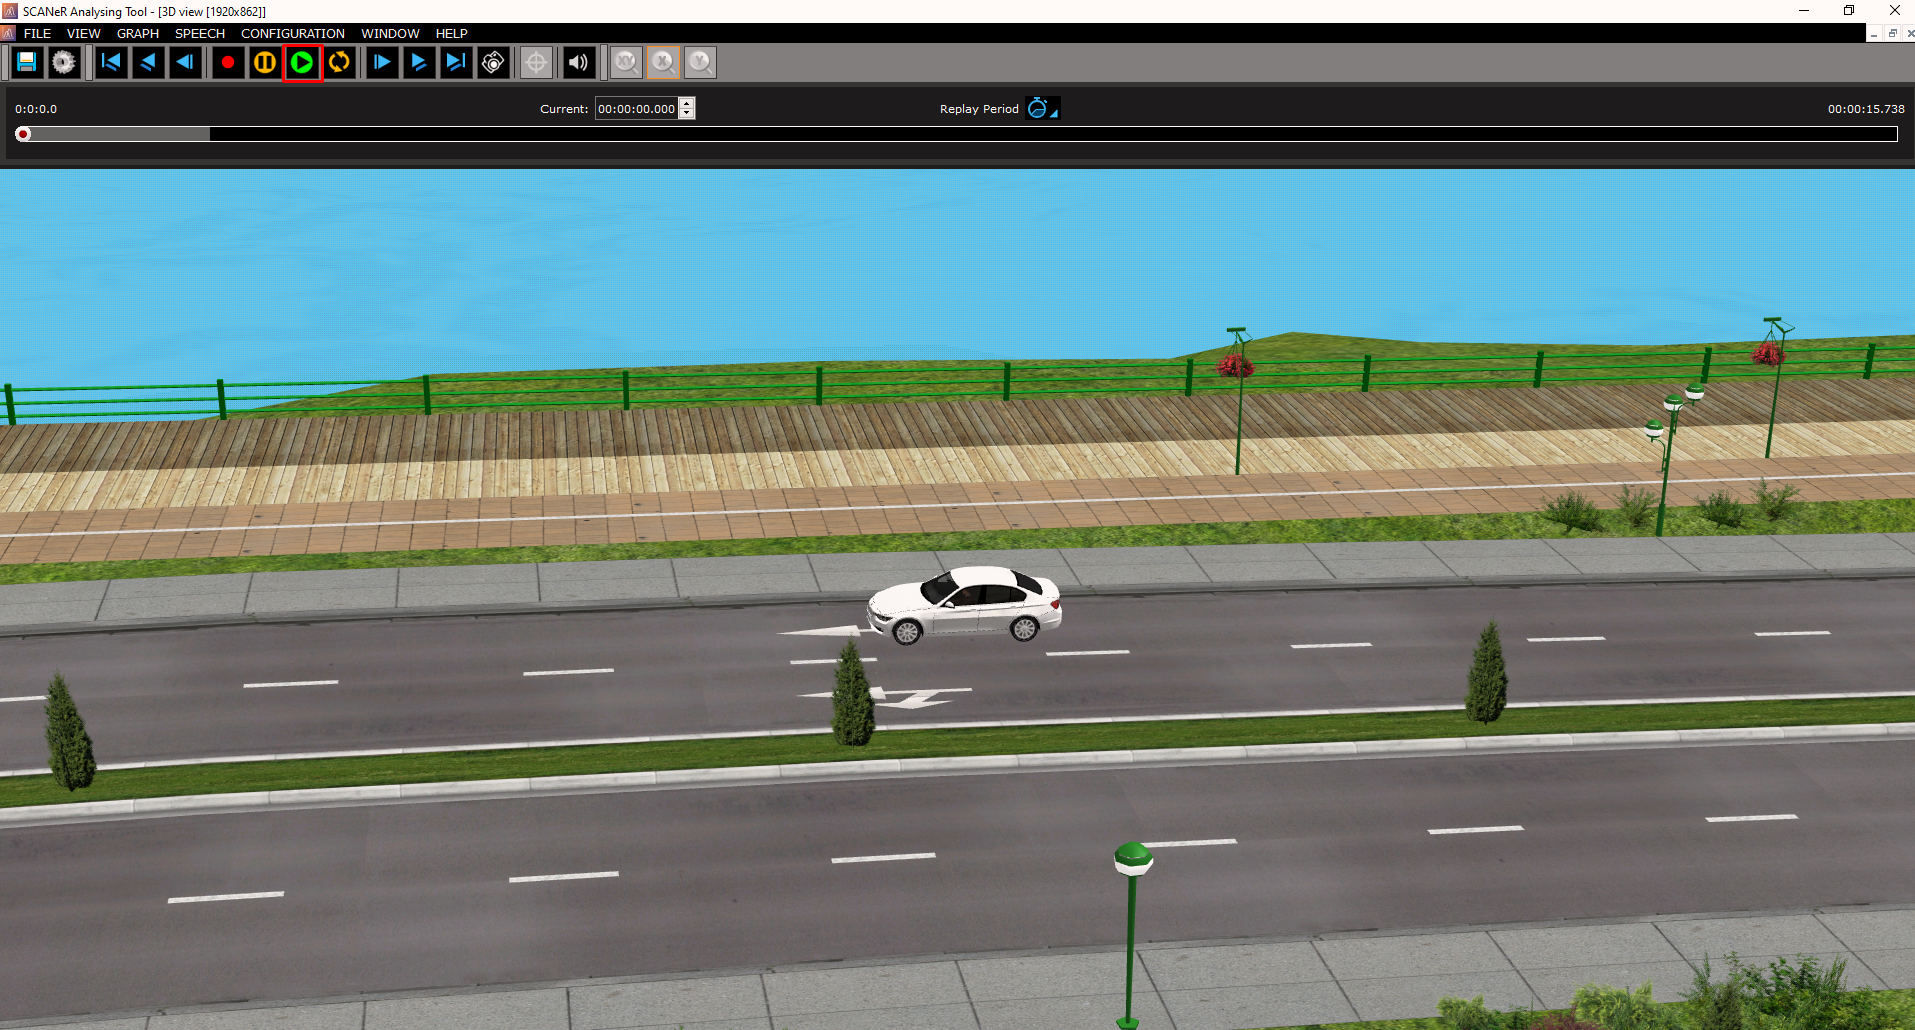
-
You can use the slider on the top of the window to control the moment you want to analyze. You can also use the graphs to control the replay, by simply holding right click on the graph and sliding to the relevant value. In the next step we will see how to create the graph and export it.
Step 3. Export a graph to a CSV file.
-
Create a new graph by going in the
GRAPHmenu and selectingNew graph.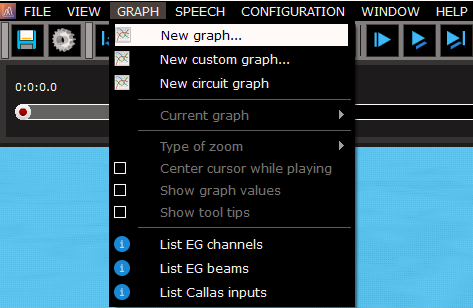
-
A window will appear and you will be able to select the data you want to visualize. In my case, I am going to extract the speed of the vehicle being tested. You can find this data under
Dynamic->Speedand you have to choose the axis. When you click onOKthe graph will appear in the analyzing tool and you will be able to move and rescale the windows.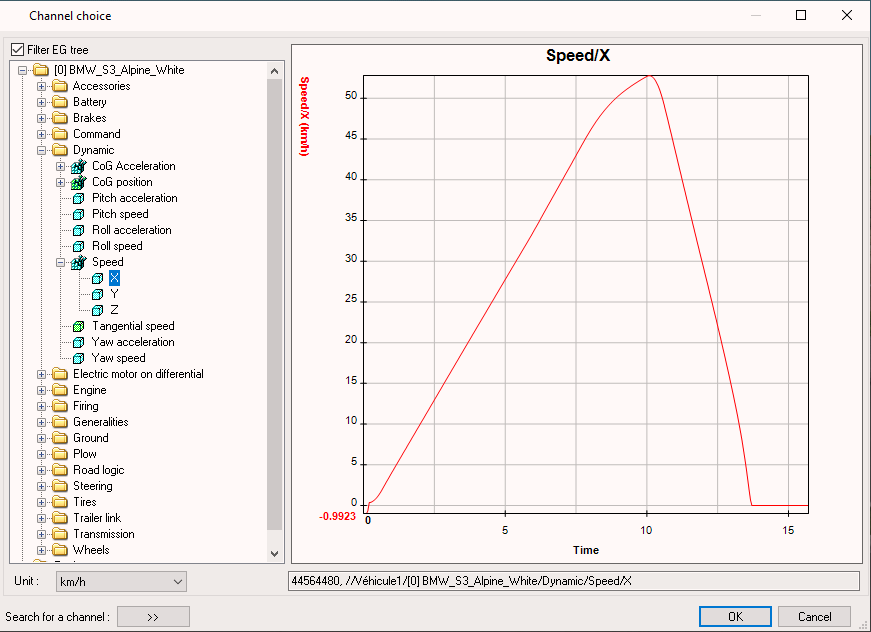
-
In order to export the graph you have to select its window, and in the
GRAPHmenu selectCurrent graph->Export to CSV.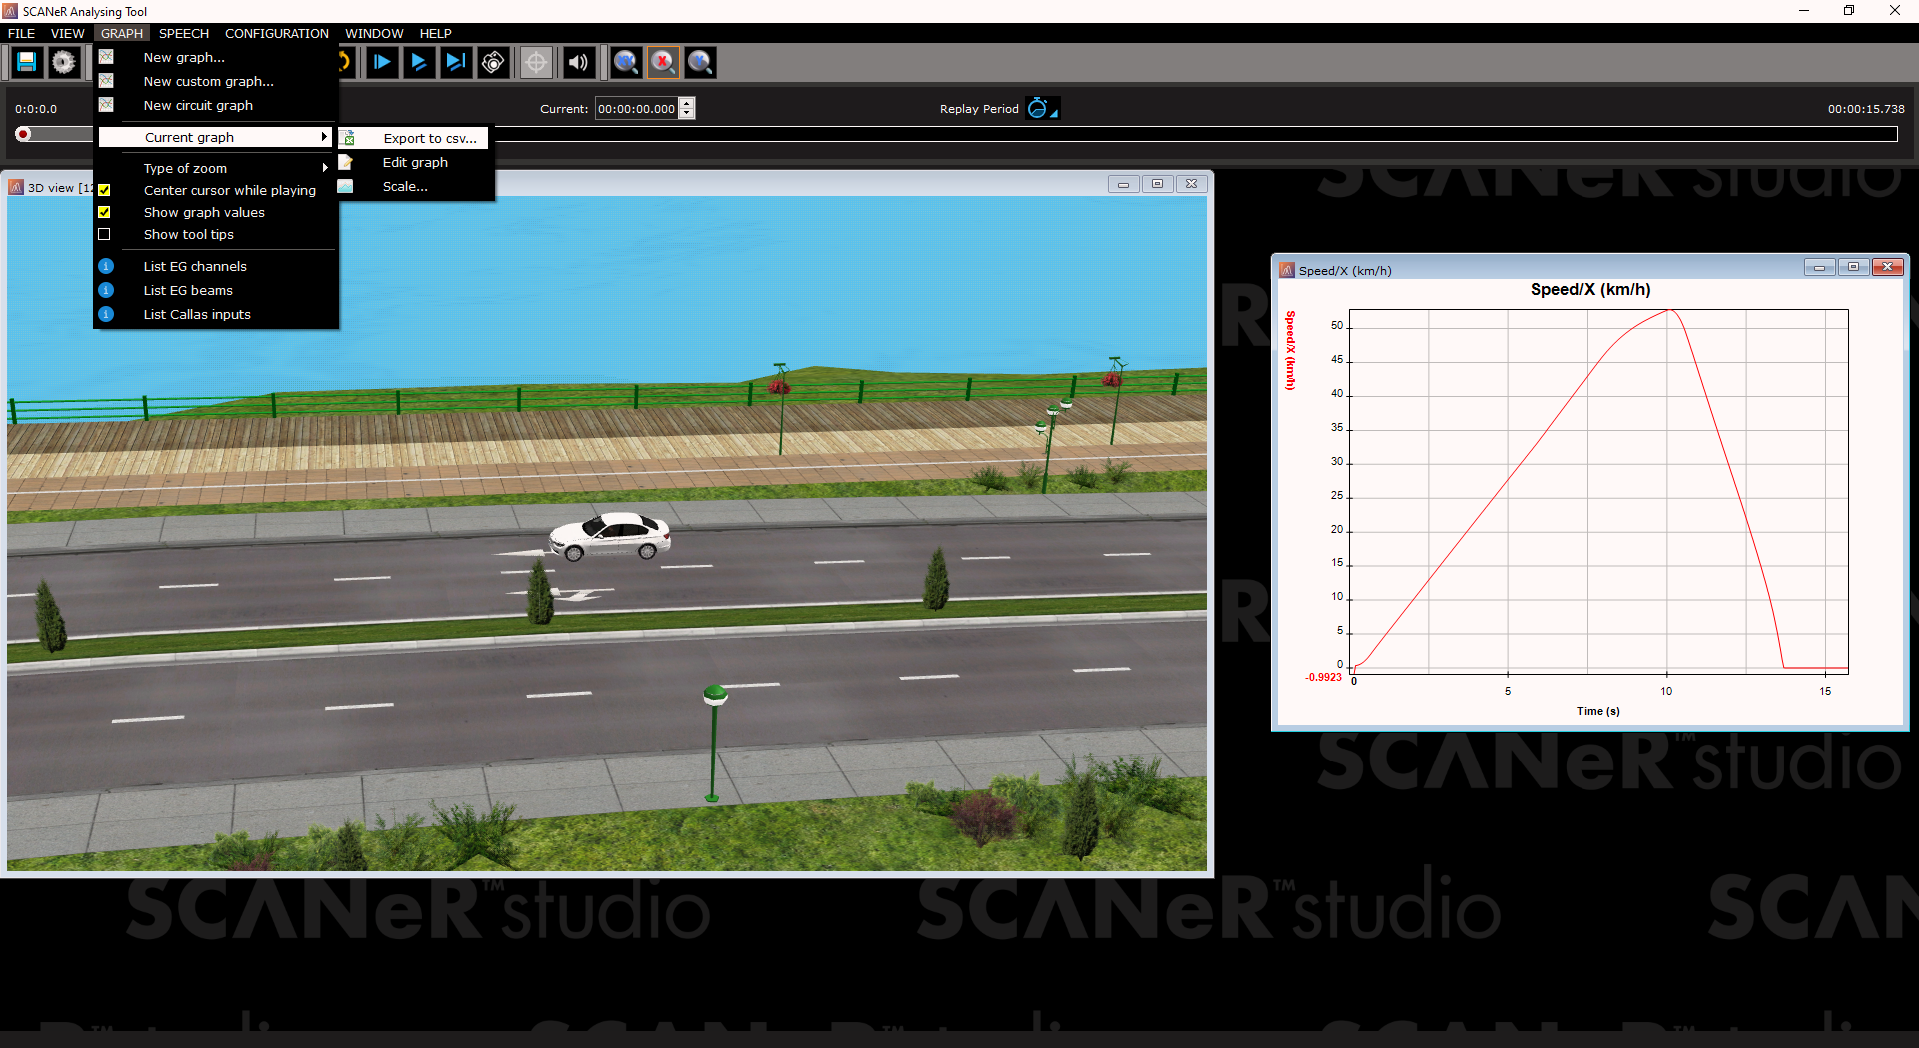
Congratulations! You now know how to record a simulation, replay it, and export data from it! 👍